Lab Spend Analytics Update
Research labs often don’t have the resources to monitor what their lab is buying, who the lab is buying from, and monthly spend. At Lab Spend, we’ve expanded the analytics to answer those questions!
As context, if you don’t currently use Lab Spend, it’s a free lab management and inventory platform. Lab Spend enables each person in your lab to request the products that they are looking to purchase. Items are tracked in the system and allow for the order status to be easily communicated in a single dashboard. Since all items are being entered into Lab Spend it’s a natural extension to show you the spending analytics of those requests.
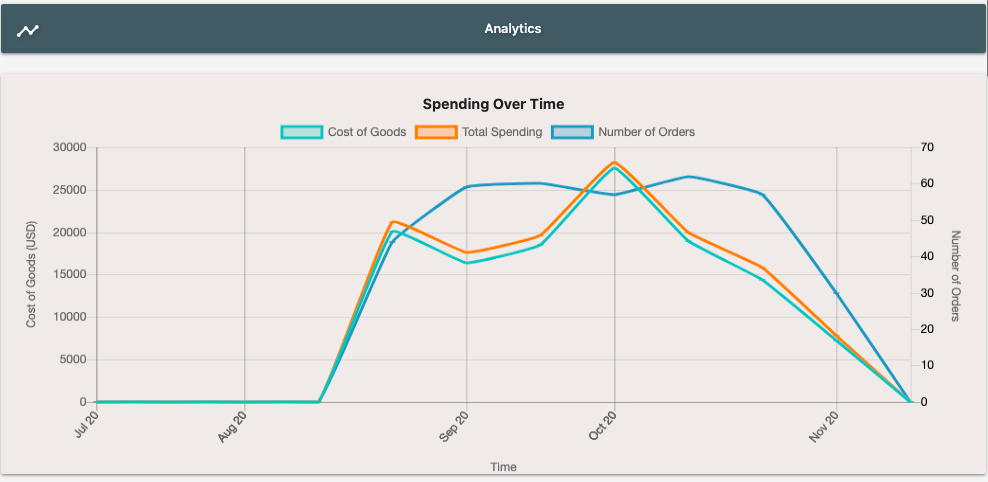
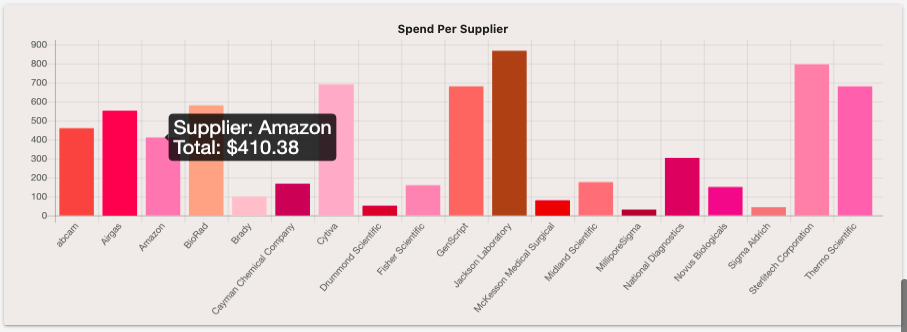
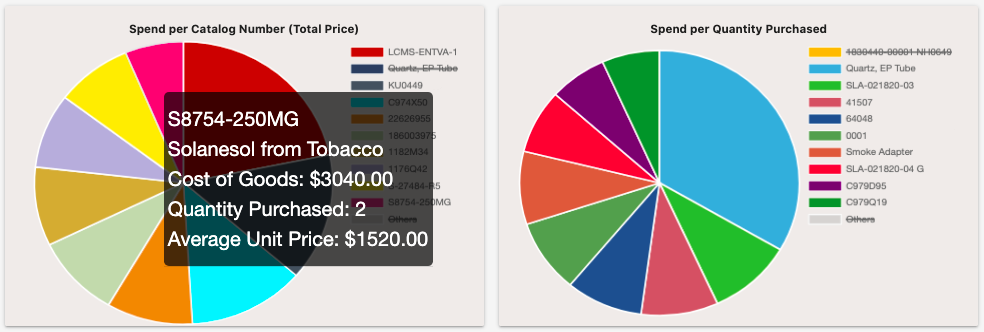
You can hover over the nodes in each graph to view more details.
Analytics automatically updates as requests are made and can be filtered such as by date and supplier. If your group is utilizing Spend Codes to tracking grants, projects, purchase orders, etc. you can filter by those as well.
This new analytics feature works along with Integrations in Analytics. Note that Integrations is permission gated so it may not be visible to all users.