Research labs often don’t have the resources to monitor what their lab is buying, who the lab is buying from, and monthly spend. At Lab Spend, we’ve expanded the analytics to answer those questions!
As context, if you don’t currently use Lab Spend, it’s a free lab management and inventory platform. Lab Spend enables each person in your lab to request the products that they are looking to purchase. Items are tracked in the system and allow for the order status to be easily communicated in a single dashboard. Since all items are being entered into Lab Spend it’s a natural extension to show you the spending analytics of those requests.
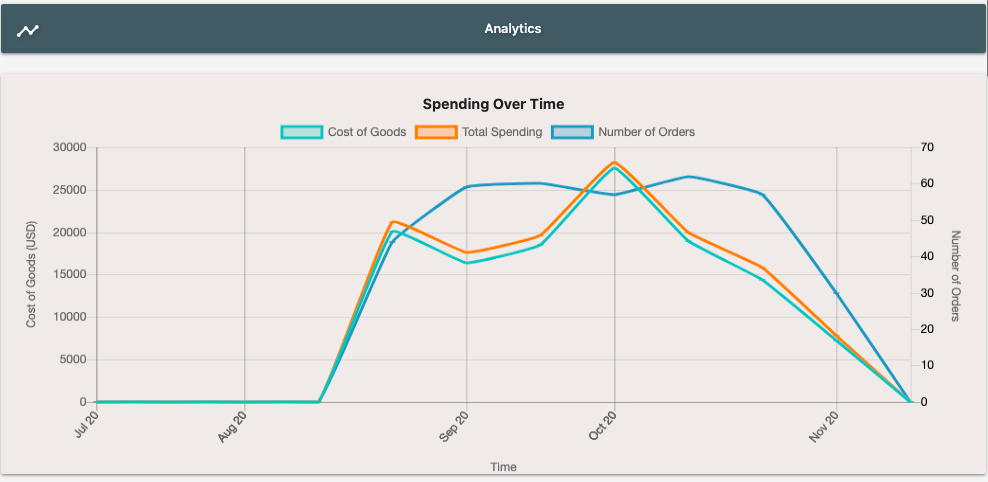
The cost of goods is shown in greet, total spend (shipping and fees added) in orange and number of orders in blue
You can hover over the nodes in each graph to view more details.
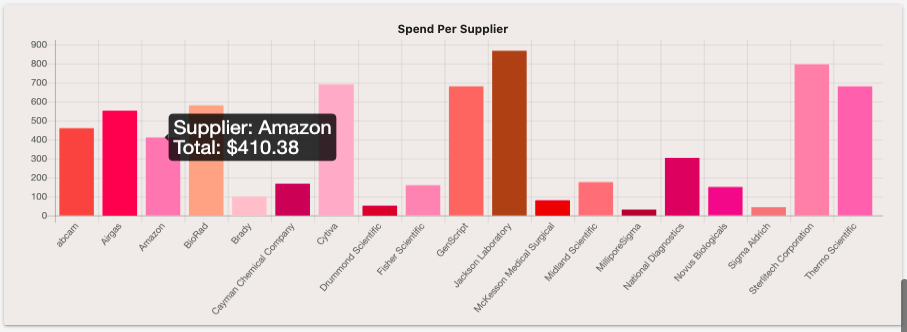
Spend by supplier
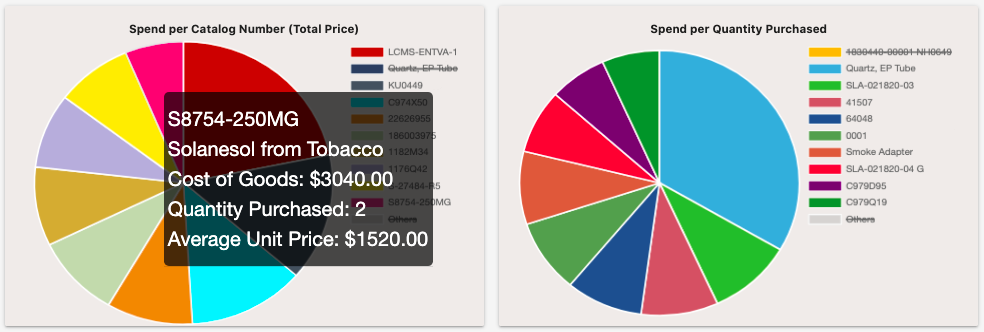
Spend per Catalog Number (Total Price) (left) and Spend per Quantity Purchased (right)
Analytics automatically updates as requests are made and can be filtered such as by date and supplier. If your group is utilizing Spend Codes to tracking grants, projects, purchase orders, etc. you can filter by those as well.
This new analytics feature works along with Integrations in Analytics. Note that Integrations is permission gated so it may not be visible to all users.
Biotechnology incubators have been helping science progress by building communities, hosting educational events, assisting with compliance, operations, and reducing costs such as having shared equipment. At a basic level, a biotechnology incubator is a shared facility where smaller companies work alongside each in a shared facility. In this post, we will explore two compliance complications that can occur at these facilities. The first is related to maintaining safety data sheets (SDSs) and the second is monitoring the total volume of flammable chemicals. These requirements can be enforced by OSHA, EPA, and fire departments.
If you are a current tenant or evaluating a shared facility it’s worth asking what the incubator’s policies are regarding compliance with OSHA, EPA, and fire department violations and possible fines. Incubators often have policies that compliance including fines will be applied to the tenant if there is a violation. Ideally, this is clearly explained in your lease agreement, but we’re finding that is not always the case. The reason is that the building owner may be the one fined and they will in turn try to collect the funds from the tenant.
The facility can be fined for tenant errors, reference, “As a building owner or manager, you may find yourself on the receiving end of an OSHA citation, even though the employees at risk from an unsafe working condition are not yours but those of a tenant or contractor… If OSHA determines that the incident was caused by the owner’s or employer’s negligence or misconduct—that is, he or she was aware of the hazard but did not abate it—the agency can impose fines as high as $70,000 for each violation, for each day that the violation existed, and for each employee affected. In addition to monetary fines, criminal prosecution may also be imposed on the owner.” Since as a tenant you could be held liable here are some questions worth asking the incubator.
When OSHA does an inspection and wants to know if all the SDSs are present, are they? What is the procedure to the ensure these documents are accurate and correctly maintained? Often incubators are request SDSs from tenants on an annual basis, but this is not in compliance. The reason is that SDSs are required to be maintained for each item as it enters the facility.
When the fire department does an inspection, who is responsible for monitoring the total volume of flammables in the facility? How are tenants kept aware of the total volume of flammables? If the total volume is exceeded how is the violation assessed?
Often each tenant company is ordering the products needed for their research, but don’t know the current flammable volumes in the facility.
Since facilities are often not monitoring what is entering their buildings and tenants don’t know what each other have on-site it creates a compliance nightmare. Although tenants according to their leases are held liable for compliance violations, it is very difficult for them to even know if they are in violation. The reason being is that tenants or facilities do not have a method of viewing inventories. We’ve found that many incubators don’t have these policies clearly outlined and are relying on the fire department not to enforce the issue. These are challenging problems that our company, Lab Spend will continue to tackle by developing free lab inventory software for both incubators and individual labs.
P212121 becomes Authorized Distributor for MilliporeSigma Products
P212121 becomes an authorized distributor of the complete MilliporeSigma product line. P212121, founded in 2010, provides industry-leading lab management and inventory software. MilliporeSigma (NASDAQ: SIAL) subsidiary of Merck KGaA, Germany – the world’s oldest pharmaceutical and chemical company.
P212121 through its latest development, Lab Spend is excited to offer over 300,000 products from MilliporeSigma to thousands of researchers using their software. Lab Spend is the industry leader in free lab management, price comparison, and inventory software.
“We’re excited to be working with MilliporeSigma to provide labs with the scientific supplies and chemicals they need to drive scientific progress,” said Sean Seaver, P212121’s Founder. “It’s great that Lab Spend is being recognized as providing a unique value to both manufacturers and sellers in the scientific community.”
About MilliporeSigma The Life Science business of Merck KGaA, Darmstadt, Germany, which operates as MilliporeSigma in the U.S. and Canada, has over 22,000 employees and 59 manufacturing sites worldwide, with a portfolio of more than 300,000 products focused on scientific discovery, bio-manufacturing, and testing services. More information is available at MilliporeSigma (https://www.sigmaaldrich.com/)
About P212121 P212121 through Lab Spend provides a completely free solution for lab management, inventory and innovate procurement assistance. More information available at P212121 (https://store.p212121.com) and Lab Spend (https://labspend.com)
At Lab Spend the majority of labs we talk with are moving away from whiteboards and spreadsheets for their lab management and inventory needs. However, some labs are using competing products such as Quartzy. If you’re a current Quartzy user, we encourage you to sign-up and schedule a demo of Lab Spend. During the demo, we will compare the features and usability of the two software systems.
Lab Spend is the leading Quartzy competitor. Lab Spend has additional features (spend analytics, pricing search engine, chemical search engine, etc.) compared to Quartzy, but also overlap in helping labs with lab management and inventory. We often transfer labs and company accounts from Quartzy to Lab Spend. The goal of this post is to answer common questions labs have about moving from Quartzy to Lab Spend.
Do you offer help moving data from Quartzy to Lab Spend?
Yes, we will help the transfer process.
What’s the best way to help with the transfer?
Exporting your data from Quartzy can be done within your account. To export your inventory, you can follow these instructions and for requests, here.
Is the transfer from process automated?
No, existing data from Quartzy is usually very dirty and needs to be manually cleaned. We can help with this process, but your team may want to help as well if you have many items in your inventory or need to move from Quartzy quickly.
How long does the transfer process take?
We often transfer labs from Quartzy to Lab Spend within a week although it depends on how many items are in your inventory and if you need requests moved as well. At times, our data team can be at full capacity due to moving other labs, which means it could be longer than a week. We’re happy to provide guidance during a demo.
Is it easy for researchers to learn Lab Spend if they’ve been using Quartzy?
Yes, the basic concept is the same in that researchers request items and their status can be tracked into an inventory system.
How do I set up a demo with Lab Spend?
You can sign up at the Lab Spend website and we will schedule a demo. During the demo, we can also answer questions that are not covered in this post.
We’re focused on creating great software for researchers. This means reviewing the functions that Lab Spend offers and in this post, we’re highlighting user interface improvements in the lab inventory section. Lab inventory shows items as cards as shown below:
After clicking on item card, it expands showing additional actions: Submit Request, Mark Depleted, Checkout/Return, Delete and Edit
In this post, we will explain our thoughts on improving the item card making it easier for researchers to understand and use.
Updating Quantity:
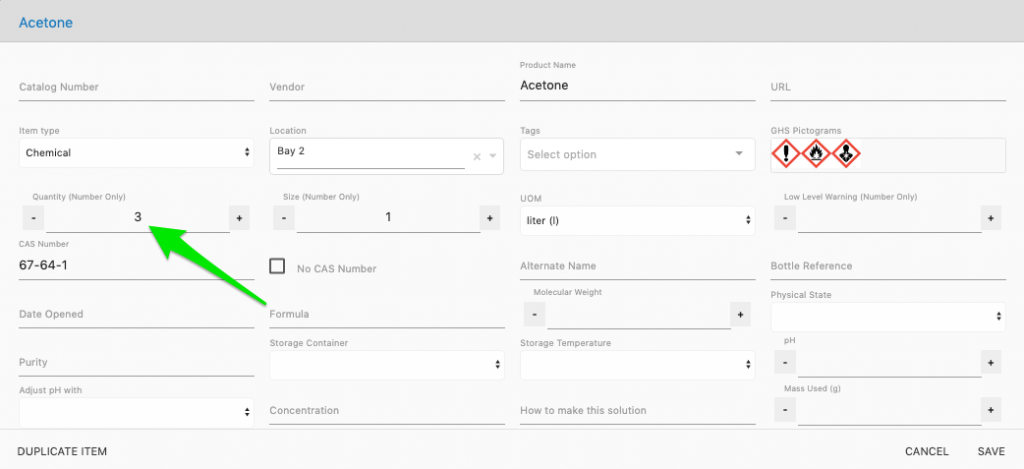
The quantity field is frequently adjusted used by researchers. If an action happens a lot then we want to keep revisiting it to determine if it can be improved. For editing the quantity, users clicked on the item, Edit then change the quantity once the item modal appeared as shown below:
It takes two clicks to be able to adjust the quantity plus time to find the quantity field if you’re a new user. How can we improve this experience?
To improve it, we moved the quantity field to the front of the item card. This eliminates clicks and makes the quantity easily visible, as shown in the image below:
Now researchers can simply use the toggles to quickly adjust the quantity as needed.
Checked Out:
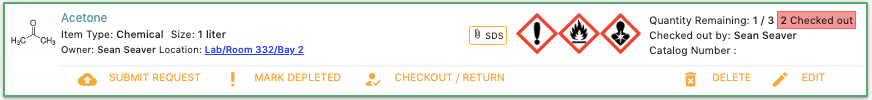
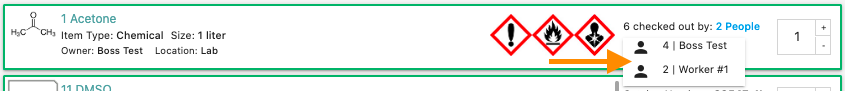
In Lab Spend, you can check out items from the inventory system. Check Out, represents when a researcher has an item in their possession. For example, a researcher may need to use a hotplate at their bench for a day and by checking it out, lab mates would know who to contact and why it isn’t in the location listed in the inventory. The Checked Out feature has been cleaned by removing the ratio shown on the item cards (the 1/3, just left of green arrow below).
The ratio represented how many units were checked out of those available. However, this was causing confusion as researchers thought the ratio was displaying how units were remaining from the initial order. The ratio has now been removed, cleaning up the item card. If multiple people have checked out an item, you can now view their names with a quick hover over as shown below:
Depleted:
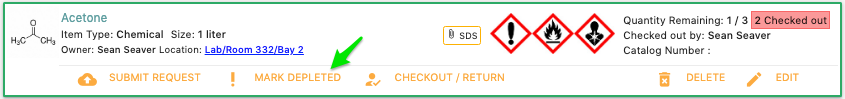
Researchers can mark items as Depleted when they run out which is very useful as it keeps all the information that has been entered as compared to the delete option. To mark an item as depleted, you needed to click on the Mark Depleted button shown in the image below:
Once clicked, the quantity would update to zero and lines appear on the item indicating that it isn’t in stock. However, a better experience would be for users to adjust the quantity to zero and the item automatically becoming depleted. This improvement allowed us to remove the Mark Depleted button.
Simplifying the user interface makes it more streamlined to use. Researchers have enough to think about but how to use software shouldn’t be one of them. If you’re looking for a free lab inventory solution, feel free to sign up for Lab Spend.
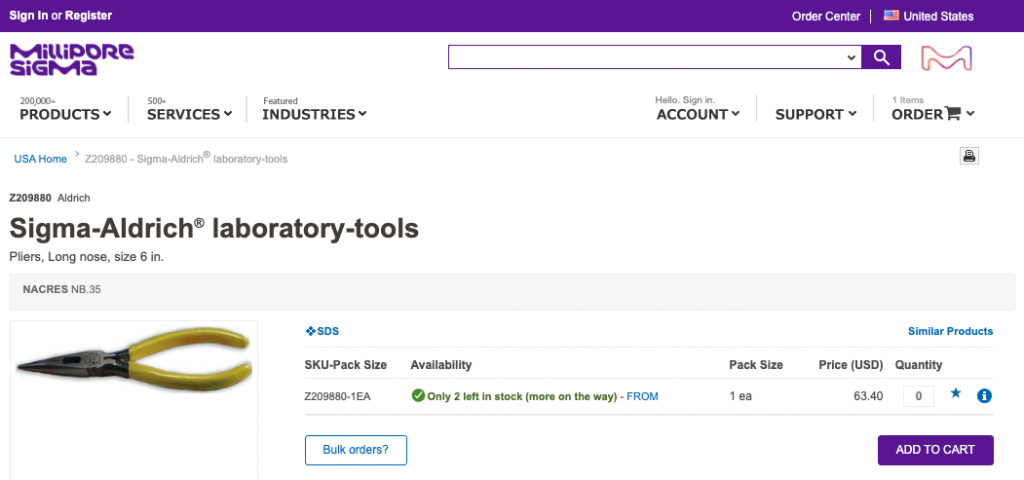
If you buy scientific supplies then you know it can be costly. The list price from major vendors is completely ridiculous. For example, Millipore Sigma (Sigma-Aldrich) is offering 6-inch long nose pliers for $63.40.
Currently, Amazon is offering a similar (maybe better the handle looks nice) pictured below for $8.40 that’s over a 7.5x difference.
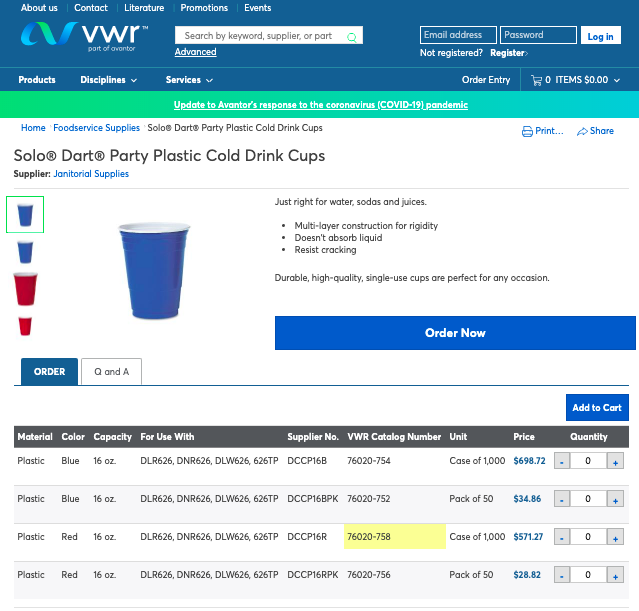
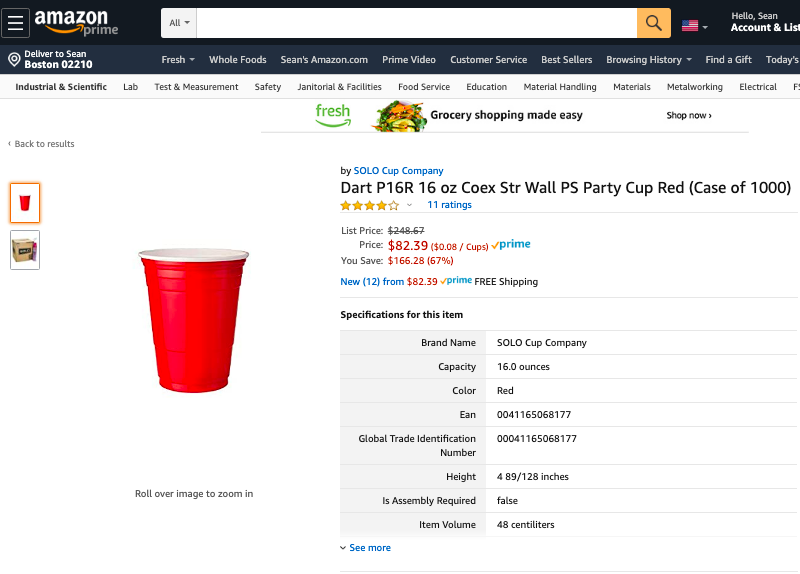
Next is pricing on the same product comparing VWR and Amazon.
VWR price is $571.72 verse $82.39 which is nearly a 7x difference.
These examples lean more toward everyday items, which we hope are more relatable rather than specialized lab supplies so most readers can understand the extent of the markup.
I can hear it already, “Everyone knows that you shouldn’t buy everyday items from scientific suppliers… Scientific suppliers are useful in supply specialized items that are needed for research.” Good point.
Let’s look at a specialized product knowing that perhaps not everyone may understand its use.
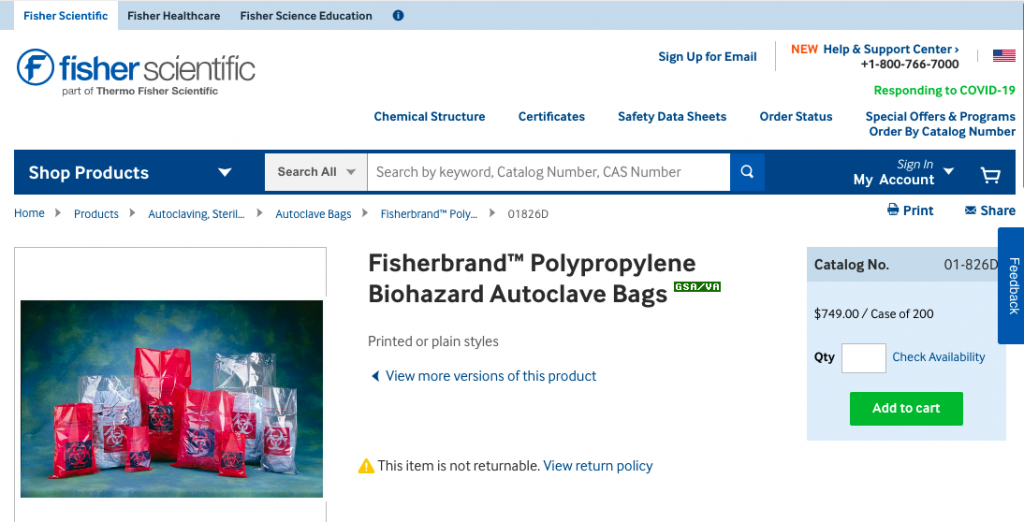
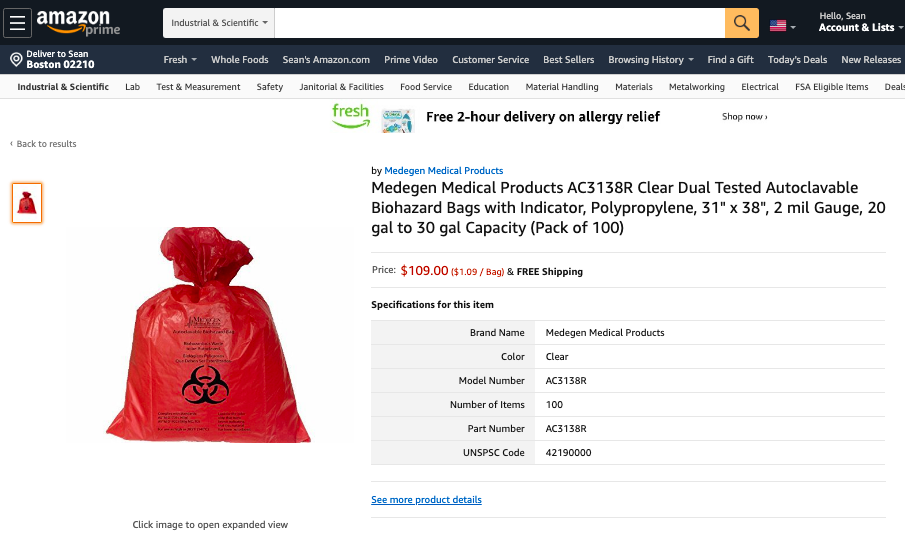
Polypropylene Biohazard Autoclave Bags, same size, and thickness with Fisher Scientific offering a 200 count and Amazon 100 count.
Fisher Scientific list price $749.00 and Amazon $218 (doubled the price so the count is the same), which is 3.4x difference.
What’s the takeaway? Don’t pay list price from major scientific distributors. Get quotes and ask other researchers what they are paying. Use our free price search tool in Lab Spend to look learn about market prices. Don’t accept a price from large scientific distributors as a decent only because it is 20% less than list price.
How is COVID-19 influencing the spending of research labs?
At Lab Spend, we help labs monitor how they spend millions of dollars on research chemicals and supplies. The market is dynamic in that some labs are researching COVID-19 and are very busy. However, other labs could be closed or functioning in maintenance mode.
Below is the total spending of all companies using Lab Spend taking into accounts that joined or left our service.
The decline in spending of research labs from March to April was 64%. The y-axis has been intentionally been removed. While we don’t have enough data to project spending across the entire industry, we thought it would be interesting to examine how and if the spending is changing.
We make free lab inventory software and are considering offering Bluetooth stickers as a better way to monitor lab inventory. This type of product doesn’t exist so we are reaching out to get feedback and see if there’s interest.
The benefit to labs would be massive time savings since it would essentially eliminate barcoding, scanning, quantity tracking and reconciliation tasks. Just instant updates through the phone in your pocket. The stickers are small and flexible enough to be placed on the majority of items.
Bluetooth Sticker Technical Details:
10m range (30 feet) in the lab
12 month battery life
Water resistant
Flexible (fits around the head of a wine bottle, testing is tough sometimes)
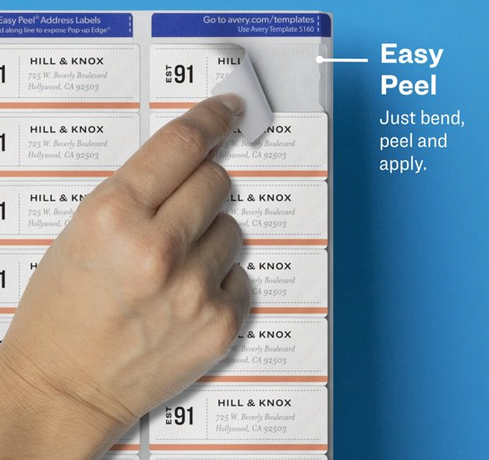
Size of an Avery barcode label (~9 x 77 mm and 0.5mm thick or 1.1 x 3 inches and 0.2 inches thick), image below for a size reference
We are targeting a price point of $2 per a sticker and production would be in about 8 to 12 weeks depending on the response. The initial production would be for 25,000 units and are asking if your lab or your stockroom wants an allocation. Labs commonly have 500 to 1,000 items therefore we need about 50 labs that are interested.
We initially emailed this request to current Lab Spend users and the response has been great! Here are some FAQs so far:
Why not NFC or RFIDs instead of Bluetooth?
The range of NFC and RFIDs is about the same distance as scanning barcodes. We’d like to inventory all the items in a room just by standing in the room.
Do the Bluetooth stickers interfere with each other?
No, we’ve tested over 1,400 stickers in close proximity.
If Bluetooth stickers are of interest, please send us an email to support@labspend.com
Benefits of an Integrated Procurement and Inventory System
Integrating your procurement, inventory and safety data sheets (SDSs) management systems offers significant advantages over using separate, discrete systems. In this post we highlight the reasons and how using Lab Spend increase lab efficency.
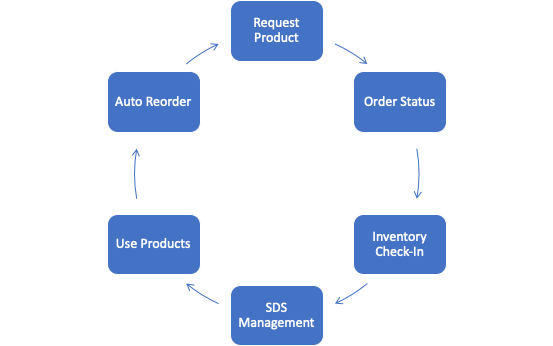
Lab Spend is an integrated system which begins by requesting a product at the top of the work cycle shown in the figure below:
From the first step of Request Product, Lab Spend begins auto-completing data to save you time (more details here). The centralized dashboard allows all members to view requests and orders. Once an item is received, it is placed into your inventory. SDS files can be attached to each item in your inventory keeping the system in sync. Products are used and once depleted, a simple click requests the product again.
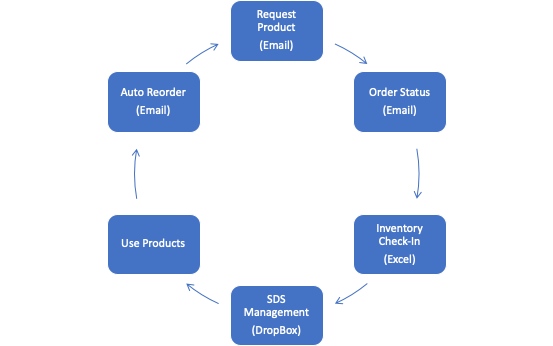
The figure below shows examples of different discrete systems that research labs use prior to implementing an integrated system:
Biotechnology companies using discrete systems require a manual process to move data between systems since they’re not designed to work together.
The manual process of emailing updates costs time and communication such as status updates is often implemented inconsistently. For example, a lab manager may be trying to keep track of hundreds of items with various status (back-ordered, returned, item missing, item damaged, etc.) and then trying to communicate that to dozens of researchers is a difficult system to maintain. Often the lab manager is unable to monitor theses status and is only able to provide updates when requested by researchers. If a researcher is requesting an update is inefficient and if there is a problem it can be difficult to correct quickly such as being made aware that a critical product will be arriving weeks later than expected.
Moving along in the cycle once an item arrives it is placed into the inventory system often Excel. Since Excel doesn’t easily handle file storage, labs may use a shared DropBox folder for their SDSs, but these two systems don’t automatically synchronize causing them to drift apart over time. Since the inventory and SDSs drift apart it causes inaccuracies making the lab at risk for safety violations.
In Summary:
Integrated Lab Management Systems:
Synchronized data
Reduced data entry, therefore, reducing errors
A seamless transition between placing Product Requests, Orders, Status Updates, Receiving into Inventory, and re-Ordering
Specialized notifications and emails such as for low stock levels, service reminders or chemical expirations
Discrete Lab Management Systems:
Labor-intensive processes
Hard to manage through email
No synchronization between systems
Increased safety violations due to management difficulty
Increasing the requirement for manual inventory checks
Time-consuming to determine if all SDSs are on site
Identifying Savings Opportunities in Scientific Supplies and Chemicals
Previously, we modeled what specific universities and companies were paying for acetone and gloves. Today, we’re taking a more macro-level view and answering more broad based.
The data set we will be using contains over 10 billion dollars in pricing information. The data is comprised of information contributed by researchers, procurement departments and through freedom of information requests. The goal is to model the market price for research chemicals and supplies which is very different than the list prices.
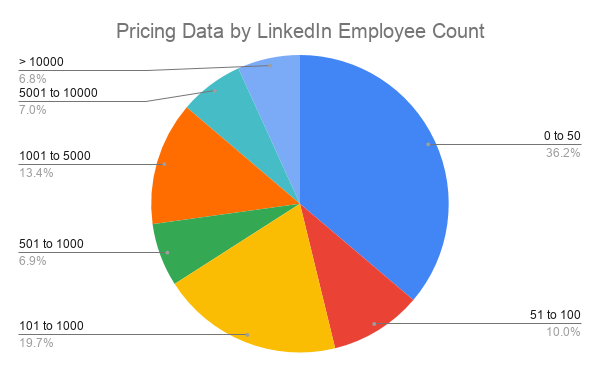
We divided the data into the following segments which are universities and small and large companies. If a company had less than 100 employees on LinkedIn they were classified as small and if greater, large. We also have a segment of ‘other’ such as pricing data from cities, states, hospitals and those that we have not yet categorized. The distribution of the university and company is currently (January, 2020) as follows:
It’s worth noting that the budget spent on scientific supplies and chemicals is not perfectly represented by company size, but there is a trend. For example, a pharmaceutical company with 200 employees could be spending more than a non-research focused company that has 5,000 employees.
On average, do universities get better prices than companies on scientific supplies and chemicals?
Yes, when comparing the segments on average price paid, universities are paying 9% less, small companies 5% more, large companies 4% less and the other segment is paying 4.5% more. This information is also displayed in the table below:
Segment
Compared to Average Price
Universities
9% less
Small Companies
5% more
Large Companies
4% less
Other
4.5% more
Do universities get the best prices?
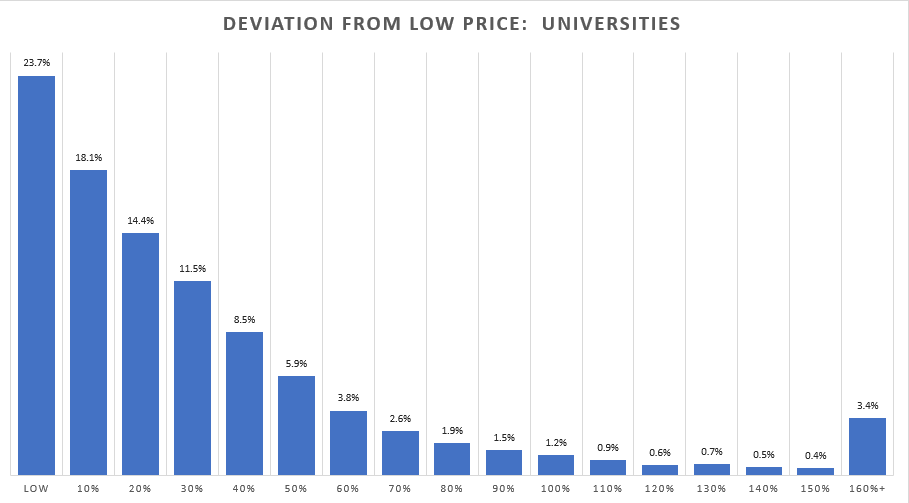
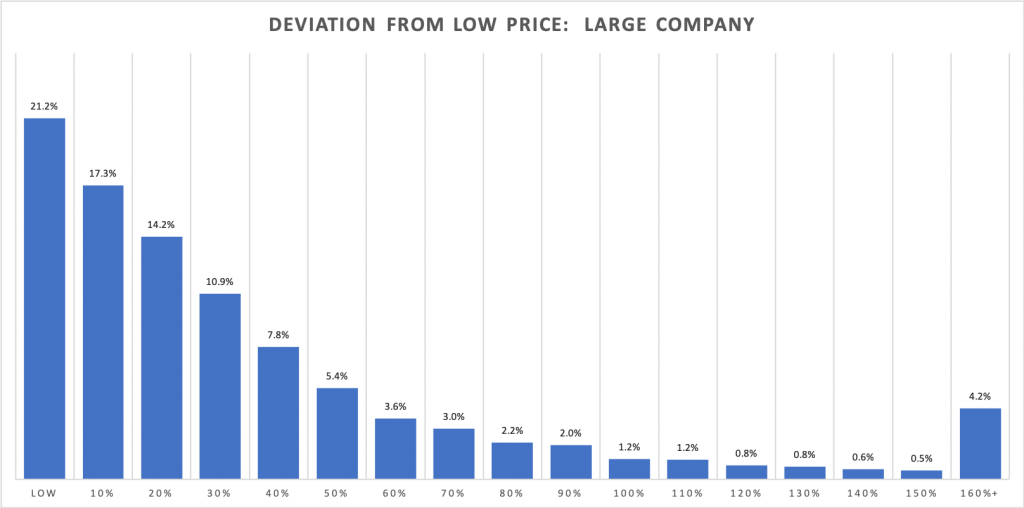
It varies, if we compare universities and large companies there is nearly an equal distribution of who is attaining the lowest price for a product.
So far, we’ve classified the 44.8% of the current data and universities are paying the lowest price 23.7% of the time while large companies are paying the lowest price 21.2% of the time. The distribution represents the percentage greater than the low a university or large company is paying. The distribution is quite similar, for example, 18.1% of the time universities are within 10% of the low while it is 17.3% for large companies.
Three insights from the graphs above: 1) The likelihood of a university or large company having the lowest price on a product is about the same. 2) Universities and large companies are paying within 20% of the overall low price 56% and 52% (we’re summing the left most 3 percentage segments from the graph above) of the time respectively. This means that just under half of the time the price for an item is within 20% more than the lowest price. 3) The instances where the low price percentage difference is extremely high (i.e. greater than 160%) are likely to be based on areas of limited coverage such as only 2 data pricing data points for a product.
Is it possible to save significant money from existing suppliers that provide lab supplies and chemicals?
Yes, we see significant variation at the item level within a company. A company can have near or the low price and be buying items that are more than 100% of the low. Often the top 10 items purchased by spend are priced competitively as they tend to be a focus of procurement departments. The opportunity is identifying these high priced items with meaningful spend and requesting improved pricing while also considering alternative supplies.
How much does time influence pricing?
Very little, in other words, if you buy a product in 2015 and in 2020 the price difference is insignificant compared to the initial price you paid. Your pricing will increase over time and it’s worth doing that analysis and would be concerned if the pricing is increasing at a rate greater than 3 to 5% per a year without a justification. Going back to the original question, for example, if you paid $150 for Kimwipes in 2015, you could be at $180 in 2020, however, the more significant factor is that there is another client paying $75 (half the amount) in 2015 who is now paying $110.
We consult with clients to help them identify the roughly 46% of products that they are paying 30% or greater than the low price. We also help identify alternative products. If that is of interest, please reach out at us support@labspend.com