Identifying Savings Opportunities in Scientific Supplies and Chemicals
Previously, we modeled what specific universities and companies were paying for acetone and gloves. Today, we’re taking a more macro-level view and answering more broad based.
The data set we will be using contains over 10 billion dollars in pricing information. The data is comprised of information contributed by researchers, procurement departments and through freedom of information requests. The goal is to model the market price for research chemicals and supplies which is very different than the list prices.
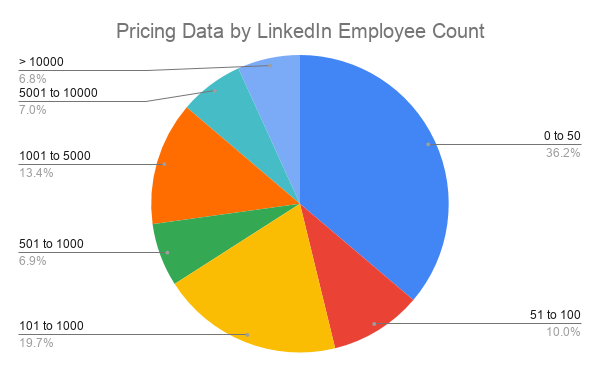
We divided the data into the following segments which are universities and small and large companies. If a company had less than 100 employees on LinkedIn they were classified as small and if greater, large. We also have a segment of ‘other’ such as pricing data from cities, states, hospitals and those that we have not yet categorized. The distribution of the university and company is currently (January, 2020) as follows:

It’s worth noting that the budget spent on scientific supplies and chemicals is not perfectly represented by company size, but there is a trend. For example, a pharmaceutical company with 200 employees could be spending more than a non-research focused company that has 5,000 employees.
On average, do universities get better prices than companies on scientific supplies and chemicals?
Yes, when comparing the segments on average price paid, universities are paying 9% less, small companies 5% more, large companies 4% less and the other segment is paying 4.5% more. This information is also displayed in the table below:
| Segment | Compared to Average Price |
| Universities | 9% less |
| Small Companies | 5% more |
| Large Companies | 4% less |
| Other | 4.5% more |
Do universities get the best prices?
It varies, if we compare universities and large companies there is nearly an equal distribution of who is attaining the lowest price for a product.
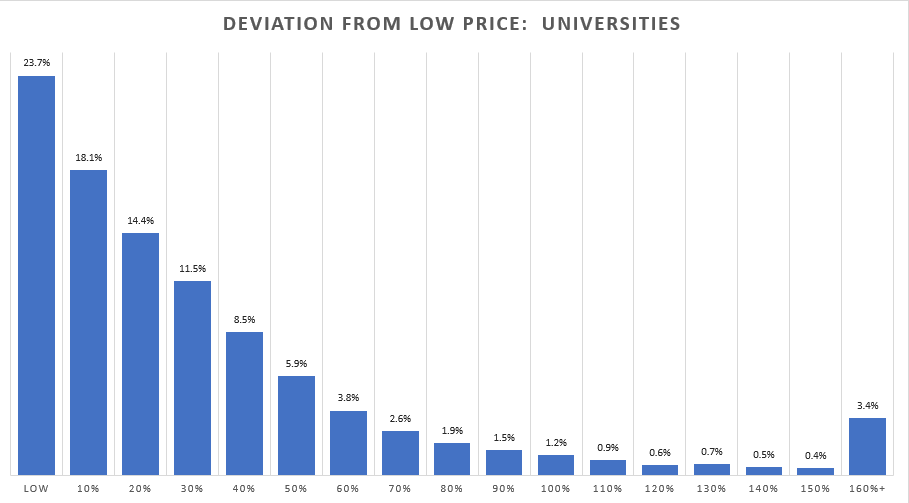
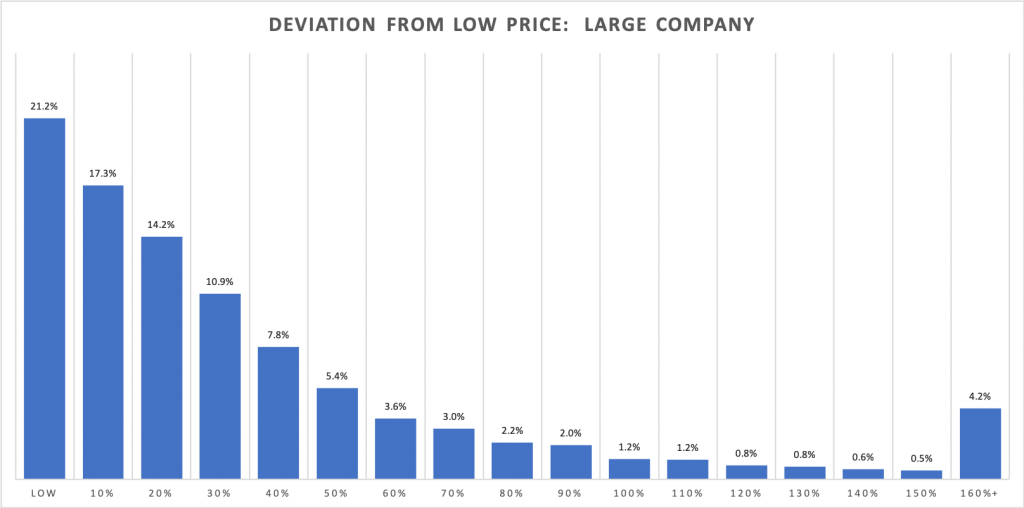
So far, we’ve classified the 44.8% of the current data and universities are paying the lowest price 23.7% of the time while large companies are paying the lowest price 21.2% of the time. The distribution represents the percentage greater than the low a university or large company is paying. The distribution is quite similar, for example, 18.1% of the time universities are within 10% of the low while it is 17.3% for large companies.


Three insights from the graphs above:
1) The likelihood of a university or large company having the lowest price on a product is about the same.
2) Universities and large companies are paying within 20% of the overall low price 56% and 52% (we’re summing the left most 3 percentage segments from the graph above) of the time respectively. This means that just under half of the time the price for an item is within 20% more than the lowest price.
3) The instances where the low price percentage difference is extremely high (i.e. greater than 160%) are likely to be based on areas of limited coverage such as only 2 data pricing data points for a product.
Is it possible to save significant money from existing suppliers that provide lab supplies and chemicals?
Yes, we see significant variation at the item level within a company. A company can have near or the low price and be buying items that are more than 100% of the low. Often the top 10 items purchased by spend are priced competitively as they tend to be a focus of procurement departments. The opportunity is identifying these high priced items with meaningful spend and requesting improved pricing while also considering alternative supplies.
How much does time influence pricing?
Very little, in other words, if you buy a product in 2015 and in 2020 the price difference is insignificant compared to the initial price you paid. Your pricing will increase over time and it’s worth doing that analysis and would be concerned if the pricing is increasing at a rate greater than 3 to 5% per a year without a justification. Going back to the original question, for example, if you paid $150 for Kimwipes in 2015, you could be at $180 in 2020, however, the more significant factor is that there is another client paying $75 (half the amount) in 2015 who is now paying $110.
We consult with clients to help them identify the roughly 46% of products that they are paying 30% or greater than the low price. We also help identify alternative products. If that is of interest, please reach out at us support@labspend.com