Category: Lab Inventory

Biotechnology Incubators and Facility Inventory

Biotechnology Incubators and Facility Inventory

Biotechnology incubators have been helping science progress by building communities, hosting educational events, assisting with compliance, operations, and reducing costs such as having shared equipment. At a basic level, a biotechnology incubator is a shared facility where smaller companies work alongside each in a shared facility. In this post, we will explore two compliance complications that can occur at these facilities. The first is related to maintaining safety data sheets (SDSs) and the second is monitoring the total volume of flammable chemicals. These requirements can be enforced by OSHA, EPA, and fire departments.

If you are a current tenant or evaluating a shared facility it’s worth asking what the incubator’s policies are regarding compliance with OSHA, EPA, and fire department violations and possible fines. Incubators often have policies that compliance including fines will be applied to the tenant if there is a violation. Ideally, this is clearly explained in your lease agreement, but we’re finding that is not always the case. The reason is that the building owner may be the one fined and they will in turn try to collect the funds from the tenant.

The facility can be fined for tenant errors, reference, “As a building owner or manager, you may find yourself on the receiving end of an OSHA citation, even though the employees at risk from an unsafe working condition are not yours but those of a tenant or contractor… If OSHA determines that the incident was caused by the owner’s or employer’s negligence or misconduct—that is, he or she was aware of the hazard but did not abate it—the agency can impose fines as high as $70,000 for each violation, for each day that the violation existed, and for each employee affected. In addition to monetary fines, criminal prosecution may also be imposed on the owner.” Since as a tenant you could be held liable here are some questions worth asking the incubator.

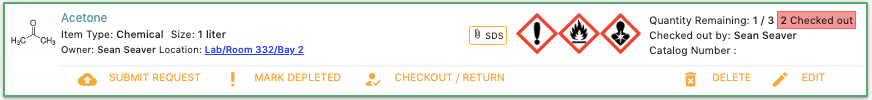
When OSHA does an inspection and wants to know if all the SDSs are present, are they? What is the procedure to the ensure these documents are accurate and correctly maintained? Often incubators are request SDSs from tenants on an annual basis, but this is not in compliance. The reason is that SDSs are required to be maintained for each item as it enters the facility.

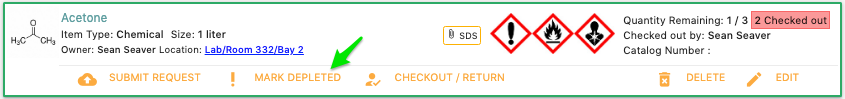
When the fire department does an inspection, who is responsible for monitoring the total volume of flammables in the facility? How are tenants kept aware of the total volume of flammables? If the total volume is exceeded how is the violation assessed?

Often each tenant company is ordering the products needed for their research, but don’t know the current flammable volumes in the facility.

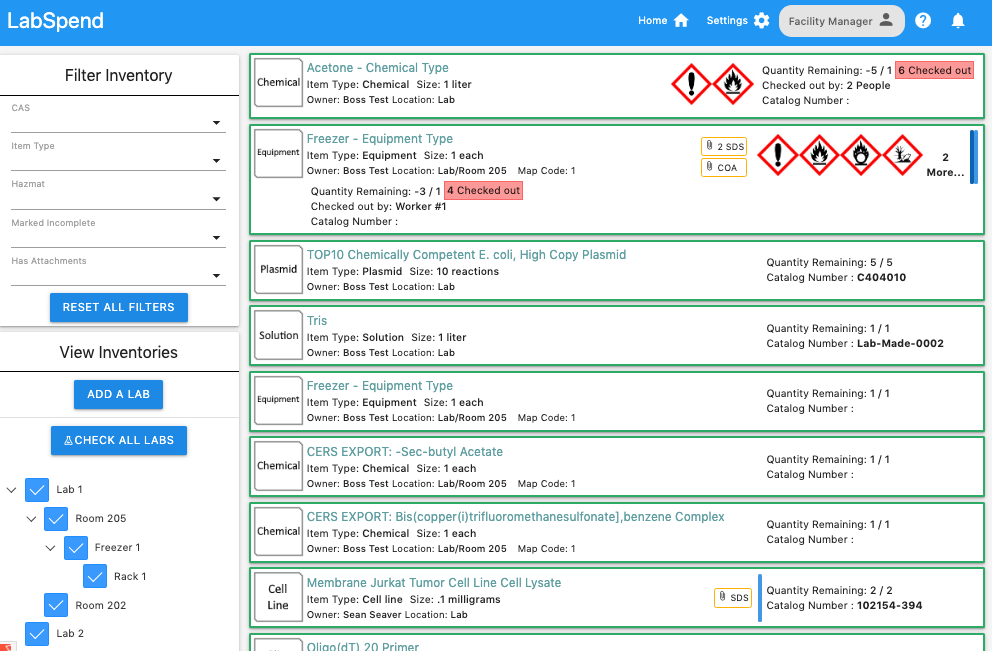
Since facilities are often not monitoring what is entering their buildings and tenants don’t know what each other have on-site it creates a compliance nightmare. Although tenants according to their leases are held liable for compliance violations, it is very difficult for them to even know if they are in violation. The reason being is that tenants or facilities do not have a method of viewing inventories. We’ve found that many incubators don’t have these policies clearly outlined and are relying on the fire department not to enforce the issue. These are challenging problems that our company, Lab Spend will continue to tackle by developing free lab inventory software for both incubators and individual labs.

Moving from Quartzy to Lab Spend

Moving from Quartzy to Lab Spend

At Lab Spend the majority of labs we talk with are moving away from whiteboards and spreadsheets for their lab management and inventory needs. However, some labs are using competing products such as Quartzy. If you’re a current Quartzy user, we encourage you to sign-up and schedule a demo of Lab Spend. During the demo, we will compare the features and usability of the two software systems.

Lab Spend is the leading Quartzy competitor. Lab Spend has additional features (spend analytics, pricing search engine, chemical search engine, etc.) compared to Quartzy, but also overlap in helping labs with lab management and inventory. We often transfer labs and company accounts from Quartzy to Lab Spend. The goal of this post is to answer common questions labs have about moving from Quartzy to Lab Spend.

Do you offer help moving data from Quartzy to Lab Spend?

Yes, we will help the transfer process.

What’s the best way to help with the transfer?

Exporting your data from Quartzy can be done within your account. To export your inventory, you can follow these instructions and for requests, here.

Is the transfer from process automated?

No, existing data from Quartzy is usually very dirty and needs to be manually cleaned. We can help with this process, but your team may want to help as well if you have many items in your inventory or need to move from Quartzy quickly.

How long does the transfer process take?

We often transfer labs from Quartzy to Lab Spend within a week although it depends on how many items are in your inventory and if you need requests moved as well. At times, our data team can be at full capacity due to moving other labs, which means it could be longer than a week. We’re happy to provide guidance during a demo.

Is it easy for researchers to learn Lab Spend if they’ve been using Quartzy?

Yes, the basic concept is the same in that researchers request items and their status can be tracked into an inventory system.

How do I set up a demo with Lab Spend?

You can sign up at the Lab Spend website and we will schedule a demo. During the demo, we can also answer questions that are not covered in this post.

Lab Inventory: User Interface Improvements

Lab Inventory: User Interface Improvements

We’re focused on creating great software for researchers. This means reviewing the functions that Lab Spend offers and in this post, we’re highlighting user interface improvements in the lab inventory section. Lab inventory shows items as cards as shown below:

After clicking on item card, it expands showing additional actions: Submit Request, Mark Depleted, Checkout/Return, Delete and Edit

In this post, we will explain our thoughts on improving the item card making it easier for researchers to understand and use.

Updating Quantity:

The quantity field is frequently adjusted used by researchers. If an action happens a lot then we want to keep revisiting it to determine if it can be improved. For editing the quantity, users clicked on the item, Edit then change the quantity once the item modal appeared as shown below:

It takes two clicks to be able to adjust the quantity plus time to find the quantity field if you’re a new user. How can we improve this experience?

To improve it, we moved the quantity field to the front of the item card. This eliminates clicks and makes the quantity easily visible, as shown in the image below:

Now researchers can simply use the toggles to quickly adjust the quantity as needed.

Checked Out:

In Lab Spend, you can check out items from the inventory system. Check Out, represents when a researcher has an item in their possession. For example, a researcher may need to use a hotplate at their bench for a day and by checking it out, lab mates would know who to contact and why it isn’t in the location listed in the inventory. The Checked Out feature has been cleaned by removing the ratio shown on the item cards (the 1/3, just left of green arrow below).

The ratio represented how many units were checked out of those available. However, this was causing confusion as researchers thought the ratio was displaying how units were remaining from the initial order. The ratio has now been removed, cleaning up the item card. If multiple people have checked out an item, you can now view their names with a quick hover over as shown below:

Depleted:

Researchers can mark items as Depleted when they run out which is very useful as it keeps all the information that has been entered as compared to the delete option. To mark an item as depleted, you needed to click on the Mark Depleted button shown in the image below:

Once clicked, the quantity would update to zero and lines appear on the item indicating that it isn’t in stock. However, a better experience would be for users to adjust the quantity to zero and the item automatically becoming depleted. This improvement allowed us to remove the Mark Depleted button.

Simplifying the user interface makes it more streamlined to use. Researchers have enough to think about but how to use software shouldn’t be one of them. If you’re looking for a free lab inventory solution, feel free to sign up for Lab Spend.

Bluetooth Stickers for Lab Inventory

Bluetooth Stickers for Lab Inventory

We make free lab inventory software and are considering offering Bluetooth stickers as a better way to monitor lab inventory. This type of product doesn’t exist so we are reaching out to get feedback and see if there’s interest.

The benefit to labs would be massive time savings since it would essentially eliminate barcoding, scanning, quantity tracking and reconciliation tasks. Just instant updates through the phone in your pocket. The stickers are small and flexible enough to be placed on the majority of items.

Bluetooth Sticker Technical Details:

  • 10m range (30 feet) in the lab
  • 12 month battery life
  • Water resistant
  • Flexible (fits around the head of a wine bottle, testing is tough sometimes)
  • Size of an Avery barcode label (~9 x 77 mm and 0.5mm thick or 1.1 x 3 inches and 0.2 inches thick), image below for a size reference

We are targeting a price point of $2 per a sticker and production would be in about 8 to 12 weeks depending on the response. The initial production would be for 25,000 units and are asking if your lab or your stockroom wants an allocation. Labs commonly have 500 to 1,000 items therefore we need about 50 labs that are interested.

We initially emailed this request to current Lab Spend users and the response has been great! Here are some FAQs so far:

Why not NFC or RFIDs instead of Bluetooth?

The range of NFC and RFIDs is about the same distance as scanning barcodes. We’d like to inventory all the items in a room just by standing in the room.

Do the Bluetooth stickers interfere with each other?

No, we’ve tested over 1,400 stickers in close proximity.

If Bluetooth stickers are of interest, please send us an email to support@labspend.com

Inventory Monitoring for Bio-incubators and Accelerators

Inventory Monitoring for Bio-incubators and Accelerators

The landscape of research and development is rapidly changing. A relatively new concept are biotechnology incubators and accelerators. These facilities help usually smaller companies by providing lab space (more incubator) and services (more accelerator like). Bio-incubators play a critical role in supporting entrepreneurs who are developing new technology.

A bio-tech incubator has tenants that are small companies who order supplies that are needed for their research. A small biotechnology company may order 25 to 100 items per a month depending where they are in their purchasing cycle and type of research. If an incubator has 15 companies then they are looking 375 to 1,500 scientific supplies and chemicals entering the facility. Incubators have the challenge of being required to know when, what and how much of a product, which are often chemicals are being stored in their facility.

How do facilities best monitor and tracking the hundreds of items that are entering their buildings?

A problem with hundreds of items entering a facility isn’t new and is very similar to how university research labs function. A give science department may have fifteen professors who are each ordering items that enter a building. The solution that universities often use, is to hire a facilities manager often with a background in environment health and safety to assist labs with governmental compliance. For example, ensuring that labs have safety data sheets (SDSs) for the chemicals in their lab. The person may also review and maintain eye wash stations, trip hazards and help with waste management. However, hiring a dedicated facility manager is impractical with the budgets of many incubators. One solution has been to bring in a consultant to help set up systems that can then be run by the incubator staff. Another solution, which we have found more common is the owner of the facility hope all the tenants are compliant with rules and regulations without any monitoring. The scary part is that the facility itself could be held liable for fines such as by OSHA based on tenants actions. Of course, more importantly, there can be a significant safety risks such as storing in aggregate excessive volumes of flammable materials could pose to everyone in the facility. This scenario could happen if, for example, three companies are ordering ethanol and no one is monitoring of the total combined volume across the companies.

What solutions should biotech incubators consider?

To help, we at Lab Spend, have developed a facilities inventory feature. The software allows each research lab to monitor their own inventory providing an easy method to enter the chemical details, quantity, volumes and upload SDSs. This is important since compliance is more than having SDSs which is all that some incubators monitor. For example, there are specific regulations in Massachusetts where we are based about total flammable volumes within a facility and even by floor. Lab Spend allows you to easily combine volumes from multiple tenants and create customized exports.

The image below shows the dashboard of the items that are stored in the facility. The items can be refined by type such as if they are a chemical and filtered by locations and company.

Dashboard of Facility Level Inventory

The facility lab inventory feature should be viewed as a tool to help make the process of monitoring and reporting research supplies and chemicals. Those that manage incubator spaces will still need to monitor the system, for example, a tenant my forget to enter a chemical. However, Lab Spend is a massive improvement from the nearly impossible task of accurately monitoring items manually.

Chemical Inventory and GHS Pictograms

Chemical Inventory and GHS Pictograms

When developing the chemical inventory system in Lab Spend, we wanted to included GHS Pictograms. Uniquely, we allow GHS pictograms to be displayed next to each item to reduce the friction in finding looking them up in the safety data sheet (SDS).

chemical inventory, ghs pictograms

Lab Spend allows users to look up the GHS Pictograms, enter them and then they can be viewed by everyone in the lab. When possible, we’re also making this task faster by autocompleting the GHS selections. In developing the software to automate this process, we’ve come across a number of interesting situations.

For example, let’s say a lab is buying a chemical from two different vendors, will the GHS pictograms be the same?

The answer is No. We see variations for the same chemical such as (-)-Nicotine Tartrate, CAS number 65-31-6 that is sold by both MilliporeSigma (Sigma-Aldrich), catalog number 1463304 and ThermoFisher Scientific under catalog number BP2533. Below is an image of the SDS, Version 5.0 from MilliporeSigma

Here is also Section 2 from the SDS, Version 4, but this time ThermoFisher:

As you may have already noticed, MilliporeSigma includes both the Acute Toxicity and Health Hazard while ThermoFisher has only the Acute Toxicity pictogram. We also looked at the percent of the product which may account for the difference, MilliporeSigma gives a range of 90-100% and ThermoFisher states >95% therefore these products can overlap in contents. If you search the NIH website by CAS 65-31-6 which is this chemical it returns four different pictograms:

Again it appears there are differences in pictograms for the same product. This isn’t an isolated case such as MilliporeSigma item 4-Hexylresorcinol, CAS Number: 136-77-6, section 2.2:

ThermoFisher offers this item with a different name, 4-n-Hexylresorcinol, but has the same CAS number.

As you can see MilliporeSigma has an Aquatic Toxicity pictogram while ThermoFisher only has the Warning pictogram. Lastly, item 2-Ethyl-2-oxazoline by MilliporeSigma has two pictograms while ThermoFisher has three.

ThermoFisher:

In this case, MilliporeSigma is missing the Corrosive pictogram.

Are pictograms optional?

Another issue you may not be aware of, is some GHS pictograms are optional in that the manufacturer has a choice of which pictogram to include. For example, Fisher Scientific sells 1,1-Di(tert-butylperoxy)cyclohexane, 50% solution in mineral oil (catalog numbers AC361310000; AC361310100; AC361312500) below is an image of section 2 of the SDS:

The top Hazard Statement corresponds to a H241 code, which is displayed below, you can see all the codes here on the NIH website.

Notice how the two GHS pictograms are shown this means that the vendor can chose either one! The vendor therefore can select explosive OR the flammable pictogram. The University of Nebraska actually mentions this exact example in their guide entitled, “ORGANIC PEROXIDES CHEMICAL HAZARDS & RISK MINIMIZATION”, which was brought to our attention by Kirk Hutchinson, who has been an excellent resource!

We see optional GHS pictograms as worrying because if a product is labeled as flammable it could also be explosive. A user of this product would not be able to tell by looking at the pictograms. It’s also concerning that SDSs for the same products are containing different pictograms. If you know why, we would be interested in hearing it!

Chemical Inventory: Item and Organizational Operations

Chemical Inventory: Item and Organizational Operations

Regulatory Aspects

Chemicals that are on a specific list, need to determine which apply to your organization and what type of information and/or data do you need to know and possibly extract about your inventory. This can be in the form of complying with specific items such as CFATS, volume related reporting such as Tier II, geography such as local or state requirements such as Prop 65 for the state of California, traits of the chemicals such as radioactive isotopes or communications such as if a chemical is hazardous and access to safety data sheets (SDSs).

Determine what regulations will apply to you and information that you need gather and report. In order to gather data it’s important to understand how the item moves throughout and interacts with your organization.

Product Movement

In short, we want to understand how an item is requested, tracked, arrives, placed in inventory, used and exits. Each organization differs, but here are details to consider in each of these steps.

Requests can be from companies (ordering) or from other labs both internal and external. What documents are need when items are arrive from an external lab?

Tracking after the request is made, who is responsible for ensuring the item arrives? How often should they monitor this process? How and with who should they communicate cancellations or delays?

Arrival, are items delivered to a loading dock, temporary inventory or directly to labs?

Who accepts packages? Does the package need to have a PO or other details to be accepted? How is the requestor notified that the item has arrived? Is this person responsible for looking for damages to the item, incorrect item or missing number of units?

Place item in inventory, does the lab record that the item has arrived? Does the item need to be barcoded, tagged or recorded? How are documents stored related to the item such as SDSs or user manuals?

Exit, how are items leaving your facility? What items can recycled or disposed of in normal trash? What items need special care such as sharps, bio-hazard or hazmat handling?

In general there are two broad examples, centralized which companies tend to follow and branched which is more popular in academics.

Centralized

Decentralized

Your particular system will likely be hybrid with certain parts being centralized (procurement and EHS) and others (ordering and item locations) branched. In universities it is common to have a more decentralized workflow with each lab ordering, tracking and monitoring their inventory. The labs may share a loading dock if their within the same building, but systems need to account for different workflows.

Organizational Workflow

Once we have a good grasp of how the item moves through the facility that will give us guidance on the human element such as departmental considerations:

Environmental Heath and Safety (EH&S) will be focused on regulatory aspects as mentioned, but also risk management. What hazards do you have on site, how to move gas cylinders properly, hazards that may develop such as peroxide formers or how much flammable liquids do you have on a given floor?

Research and Development may want to know location of products to know where items are located to streamline efficiency.

Manufacturing can be concerned with on site inventory to maintain production levels.

Procurement has an interest in idle inventory, duplicate orders, pricing and better value in both price and service.

There are more examples, but the underlying consideration is who will need to access the inventory system and what information needs to be entered and extracted from it.

Scope

Do all departments and their stakeholders need to be involved for a comprehensive solution? Is it for one lab, building, institution wide? What is the scope of implementation such as number of chemicals and to how handle different facilities?

How are we going to manage kits, propriety solutions and creating compounds? Do we need to inventory all chemicals or only HAZMAT items?

Roles and Responsibilities

Who is doing what?

Compliance, who is responsible with entering the data, less people makes this process much easier. How often will audits be done to ensure the inventory is accurate?

Permissions, who can view, edit and extract data from the system and which parts? Who is in charge of assigning permissions?

Software and Tools

The exciting part and often where companies start, please don’t start here, try to get a plan together first. It will help you determine what type of software and tools that you need.

Functionality, does it meet your goals, can it generate the reports that you need, how easy does it do it? Example of easy of use, how many times do I need to enter data? Pricing model, does it fit your budget, is it per a month, based on number of items? Is the company more focused on software or consulting? How much support will you get?

Is there a hardware component, do you need a scanner, barcode printer, can the hardware and software interact well, you don’t want to have a scanner and printer that can’t communicate or with the software system.

Is there software flexible to expand easily such as if another department wants to add it or a stockroom? What’s the roll out? How do people get trained to use the software and hardware?

Launching the Chemical Inventory

Develop a chemical inventory plan (tip: make this document user friendly so it can used as a reference for new users)

Distribute and train applicable stack holders and notify of launch date. Especially in more decentralized organizations such as universities it’s important to let professors know if they should be gathering data or someone will need access to their lab.

Plan to handle existing inventory, does it need to be barcoded? Who will handle the initial data entry? It is important to have an accurate starting point and keep in mind, the time and effort it can take to get this data entered.

Implementation, what is the start date? How will incoming items be distributed and removed from the system?

Maintenance

Quality control and reconciliation to spot check data and reports for accuracy, errors will occur (item isn’t barcoded, item moved and not reported, etc.) worst case perform on an annual basis. Who does these audits, EH&S? What will be checked and what is the criteria?

Updating new locations and employees as they come and go, how are we going to migrate chemicals to a new location? How will employees enter and exit the inventory system and who is responsible for that transition?

We’ve talked with hundreds of labs about their inventory needs and even built a software solution called Lab Spend, we’d be happy to give you a demo.

Save 15% or more on Lab Supplies

Save 15% or more on Lab Supplies

When consulting with biotech companies they’re often considering a variety of ways to save money and operate more efficiently. Here are five points to consider when trying to improve both:

Price Benchmarking

It’s important to select items for improved pricing when there’s margin to do so for the supplier or they’ll just decline. Also it’s critical to preserve supplier and vendor relationships and to make reasonable requests. You can certainly fatigue vendors by requesting quotes on the wrong items. It matters since sales reps will often prioritize quotes and customer service to reasonable clients. We help identify these items by analyzing the spend and if the price is high compared to peers. Currently, we’ve collected over 1 billion dollars of purchasing data, which allows us to provide unique insights.

Often companies mistakenly take their top ten highest spend items and request quotes on those repeatedly. It may work great the first couple of times, but long term the results stagnant. Usually companies have already done this when we talk with about pricing, which is fine, but long term it is better to be strategically selective.

Inventory Analysis

If you have an accurate inventory system in place then this analysis is made much easier. Often our clients don’t have a system that monitors their inventory. We work them to help develop solutions so that they can better track how items are moving through their companies. If you don’t have that option to examine your inventory, pick a date and from that point forward monitor what is being ordered. This will allow you to determine what items are being used and at what rate. We often find that inventories have products that are essentially taking up space and have been in the inventory for more than one year. When picking a date, start at least two years previous as it can help identify items that are never ordered again. It could be that these items have been used and are no longer needed, but often these products are sitting in inventory. At large companies this can represent millions of dollars and additional risk as products approach their expiration dates.

Shipping Costs

In addition, you can often reduce shipping costs as you begin to understand how products are being utilized. This reduction can come from ordering in large volumes and improve combinations of products. For large volumes consider both the size and number of units, for example, Fisher Scientific sells 6 x 500g of a product instead of ordering 1x. For combinations the significant savings can be found in items that require HAZMAT and overnight shipping such as enzymes. You can add a lot of value by ordering many of these items together as shipping can be $85 plus for overnight and fees (ice pack, special handing, dry ice, etc.).

Equivalent Products

Often commonly used chemicals and supplies there will be multiple vendors that can supply an equivalent product. If you’ve benchmarked your prices as mentioned above, you should have a list of targets. While it is worthwhile to approach existing vendors also consider alternatives sources. You can find these by search and asking other researchers. We spent a significant amount of time research and creating a database of more than 100,000 for scientific supplies and chemicals. It may not always be an option to change, but we’ve repeatedly found significant savings (over 65% on >25k annual spends) using this approach.

Contract Pricing Errors

A common type of error is that companies are being charged list price instead of the contract price. We’ve helped clients by cleaning their data so that they can easily identify the errors. The cleaning is the tedious but the savings falls instantly to the bottom line. After cleaning the data, simply sort by catalog number and price to find outliers. If you’re contract is for a significant percentage off of list price then the anomalies will easily stand out.

Another type of error which is more subtle is pricing increasing when you log into your account. For example, the list price for item is $175.91 and when you log into your account that price increases to $183.12.

Conclusion

If you’re able to apply these five methods mentioned you should be able to save 15% or more on your scientific supplies, equipment and chemicals. Often procurement departments have limited resources and if we had to pick one method it would to do price benchmarking.

Autofill Your Lab Inventory Data Entry

Autofill Your Lab Inventory Data Entry

Entering and updating the data your lab inventory is a tedious process.

Lab Spend can now autofill millions of inventory fields. Simply start entering your item details as usual. If there’s an item match in the Lab Spend system, you have the option of selecting to have the information autofilled.

Here’s an example from product requests, you will see an item selection as you type and once selected item fields will be populated:

You have better things to do than inventory data entry and we’re excited to help!

Lab Inventory Mapping

Lab Inventory Mapping

Where is the Microscope Room or Bay 2?

How researchers describe locations in a lab or building can be unclear. This is especially apparent in transition periods such as on boarding new hires, joining a lab yourself or moving an existing lab.

To solve this problem, Lab Spend now allows you to map your inventory

To get started, upload an image of your lab, freezer, refrigerator or more! Once uploaded go to: Inventory -> Manage -> Map

Creative labs have used images that include safety information such as eye wash stations, chemical showers and the location of gas valves.

Next, simply click from your existing locations on to the image to place a pin.

Inventory Map without pins:

Inventory Map with pins:

Need to move your freezer? No problem, you can update the pins with just a couple of clicks.

Once the locations have been placed, item location paths can be clicked to show their location.

Now anyone in the lab can search for item in your inventory then see where it is physically located in the lab.